Discover the RV LIFE Audience: Key Findings From Our Recent Survey
We want to extend a heartfelt thank you to all our readers who took the time to participate in our recent survey. Your input helps us continue to create engaging and informative content that is tailored to your needs and interests.
As you may know, RV LIFE consists of a whole sphere of seven content sites (RV LIFE, Do It Yourself RV, Camper Report, Camper Smarts, Let’s RV, RV Living, and Vanlifers). We polled hundreds of thousands of readers across our sites, and we’ve brought together the survey results from all of them to share some key highlights.
General Findings
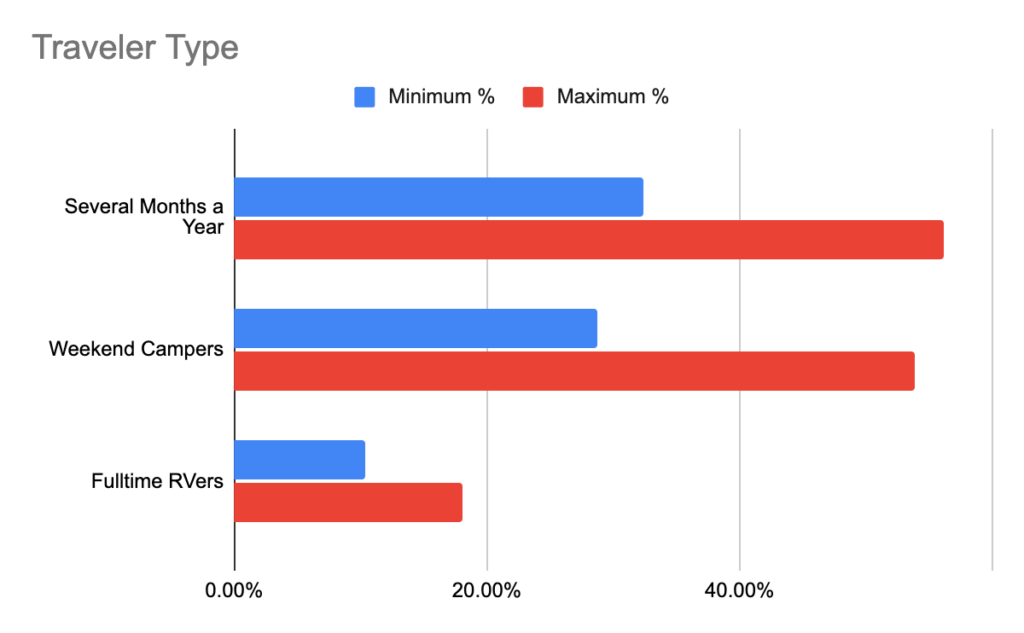
Across all sites, we found that a majority of you are aged 55 and above, with most identifying as male. In terms of travel preferences, a significant portion of you are “Several Months a Year” travelers (ranging from 32.41% to 56.16%), followed by “Weekend Campers” (ranging from 28.77% to 53.88%) and “Full-time RVers” (ranging from 10.41% to 18.06%).
RV Ownership
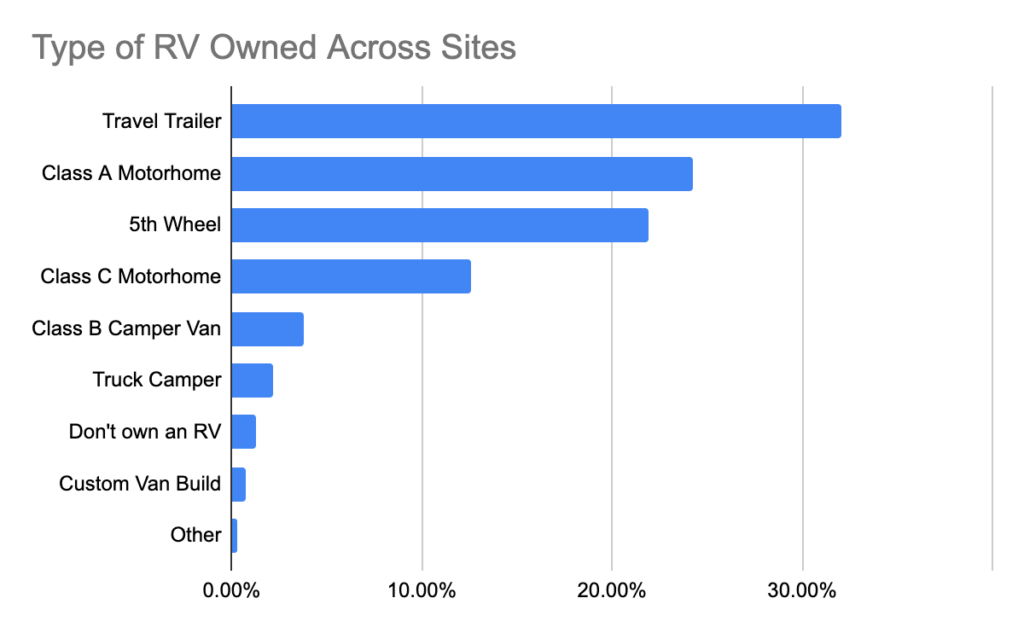
When it comes to RV ownership, Travel Trailers and Class A Motorhomes emerged as the most popular choices across most sites, securing a combined ownership of around 44% to 64%. However, the popularity of 5th Wheels and Class C Motorhomes should not be underestimated, as they also secured a significant percentage of ownership, with a combined ownership of about 25% to 36%.
Gender and Age Distribution
Our survey revealed that a majority of the respondents across all sites are aged 55 and above (ranging from 66.20% to 94.12%). Most of the respondents identified as male, with percentages varying from 61.86% to 78.73%. However, female representation was also noticeable, ranging from 18.10% to 32.99%.
Top-Requested Categories
Our audience survey revealed intriguing preferences. The most frequently requested category for all sites was “DIY maintenance,” emphasizing the importance of hands-on learning and self-reliance in the RV community. Readers place great importance on maintaining and improving their RVs through customized modifications and upgrades. These shared priorities demonstrate the passion and dedication of our readers for the RV lifestyle as they continuously seek knowledge and guidance to enhance their experiences on the open road.
Interest in Local Events
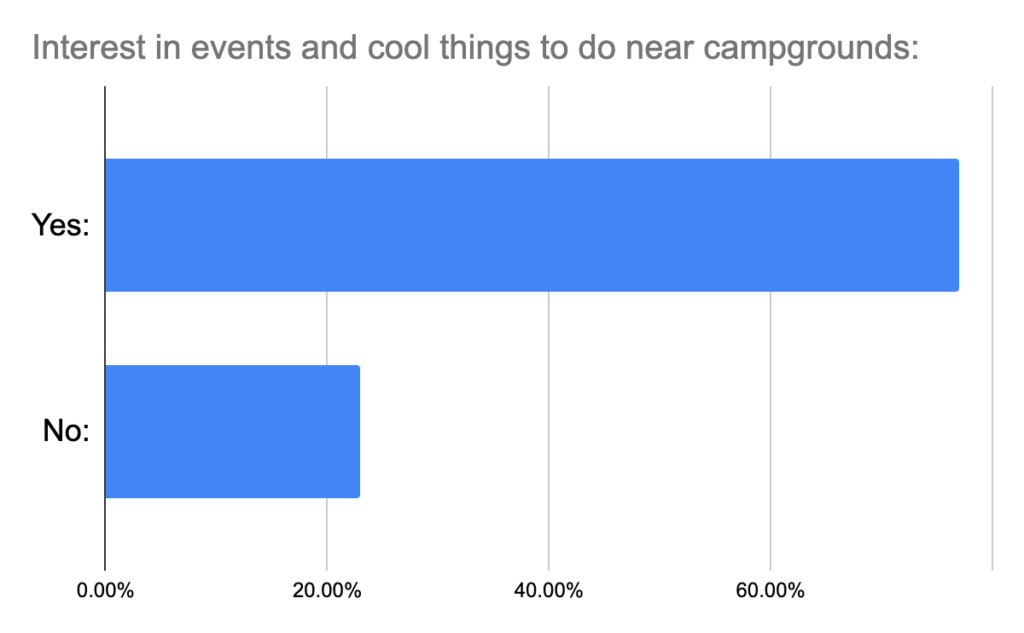
A majority of respondents across several sites expressed interest in events and cool things to do near the campgrounds they’re visiting. For example, 81.25% of Camper Report respondents and 79.19% of Do It Yourself RV respondents expressed interest in local events. This indicates that our readers are not only interested in their RVs but also in the experiences and activities they can enjoy while on the road.
RV Ownership and Travel Types Across Sites
RV LIFE
According to RV LIFE, Travel Trailers are owned by 27.40% of respondents, making them the top choice among readers. When it comes to travel preferences, 56.16% of respondents opt for several months of travel per year, indicating the attractiveness of part-time RVing.
Camper Report
36.25% of respondents to the Camper Report survey own Travel Trailers, highlighting their clear preference for this type of camping vehicle. Furthermore, a majority of the survey’s audience, precisely 50%, prefer to travel for several months each year, demonstrating their most favored method of traveling.
Do It Yourself RV
Travel Trailers are favored by 38.01% of Do It Yourself RV readers. The majority (45.70%) of respondents prefer traveling for several months annually.
Camper Smarts
Travel Trailers are also the most popular type of RV among Camper Smarts readers, with 36.61% of respondents owning one. Just under half of the respondents, at 49.78%, spend several months a year traveling.
Let’s RV
Let’s RV respondents show a slightly different trend, with Class A Motorhomes being the most popular type of RV at 24.63%, closely followed by Travel Trailers at 23.00%. Weekend and vacation trips are the most common travel preference among Let’s RV respondents, with 53.88% choosing this option.
RV Living
Class A Motorhomes are the most popular type of RV among RV Living respondents at 27.16%, closely followed by Travel Trailers at 23.49%. Weekend and vacation trips are also the most popular travel preference among RV Living respondents, with 49.54% choosing this option.
Vanlifers
Vanlifers’ respondents are unique, with 57.73% owning a Class B camper van. Full-time van lifers make up 12.37% of the site’s respondents, showing a higher percentage of full-time travelers compared to other sites.
Conclusion
Thank you for participating in our survey. Your insights will shape the future of our publications, providing valuable information for all RV and van enthusiasts.
Stay informed about the subjects you’ve requested by keeping an eye out for upcoming articles. To ensure that you’re always up-to-date with the latest news and information related to RVs, camping, or vans, be sure to subscribe to the newsletters of the websites that interest you. Simply scroll down on the website in question until you locate the newsletter signup box.
The post Discover the RV LIFE Audience: Key Findings From Our Recent Survey appeared first on RV LIFE.
